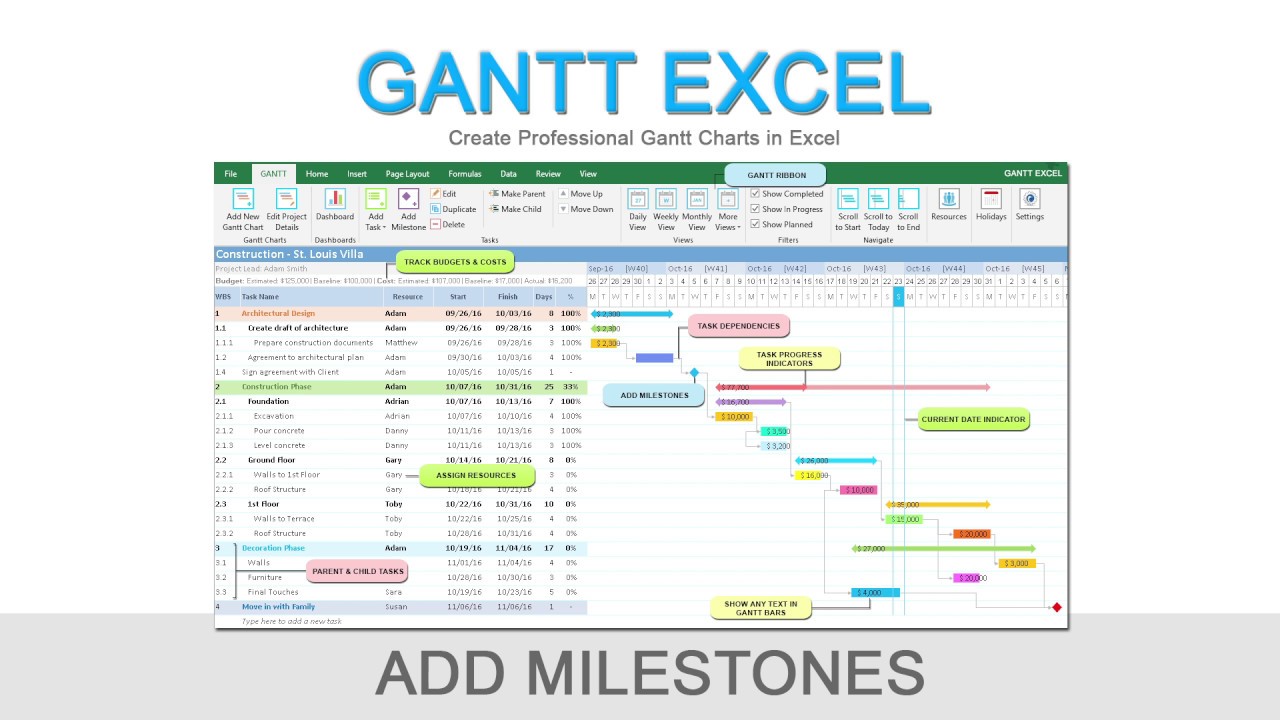
Gantt Excel is an amazing visual tool that gives you the power to organize all of your tasks and resources in one place. It gives you the ability to monitor your project from the beginning to the end without hassles. Gantt Chart is a visual representation of tasks over time that is incredibly useful for planning projects of almost any size and complexity. With Gantt Charts, you get a quick, intuitive view of each task according to its time commitment and dependencies.
Having professional Gantt Charts to manage your project plan has never been easy. With our Chart Excel, you have all the features required to make your project’s preparations more perfect and well timed. Seamless integration with Microsoft Excel and yet simple to use, which means you can start creating great-looking Gantt Charts in less than 2 minutes.
The Gantt tool is completely integrated with the real-time project dashboard. When any task is updated, the dashboard shows you the status instantly. From task status to team workload, you can track your projects anytime.
Planning and scheduling have never been so efficient. When you start a project, you can import a file or use one of our Gantt Excel templates. Simply fill in the details and your tasks populate on a dynamic project timeline. You can start assigning work to your team right away. One of the best Gantt tool is to use an excel template like Gantt Chart Excel. This is automated and easy to use. Additionally, if you use Excel you can easily create Gantt Charts, as Excel is instantly familiar.
